Limits To Growth Model : - Classical &💸Neo ClaSsical Approach 💰💸
Limits to Growth (LTG)
- In 1968, a group of about seventy-five persons belonging to different strata of society from around the world founded the Club of Rome.
- It believed that the possibilities of continuous growth have been exhausted and timely action is essential in order to avert a planetary collapse.
- It chose its initial theme “The Predicament of Mankind” in June 1970.
- It commissioned the research by four MIT scientists led by Donald Meadows which was published by the Club of Rome as The Limits to Growth in 1972.
- The second report entitled Beyond Limits was published in 1992 which gave fresh evidence as to how mankind has crossed beyond the limits.
- Jay Forester’s ‘System Dynamics’ Concept
- It was Jay Forester of MIT who in his book ‘World Dynamics‘ published in 1971 devised a model that investigates the interplay of such highly aggregated variables as world population, industrial world production, food supply, pollution, and natural resources still remaining in the world.
- Using the “system dynamics” methodology of Forester, the authors of Limits to Growth constructed an elaborate computer model of the world. They presented a large and new type of model designed to predict the future development of five global inter-related variables:
- Population,
- Food production,
- Industrial production,
- Non-renewable resources, and
- Pollution
The theory is based on the thesis that “the continued growth leads to infinite quantities that just do not fit into a finite world.” This basic idea has been elaborated in a highly complicated model which cannot be easily described in equation form.
- Among the various relationships, there are “feedback loops” that register the effects of changes in one variable such as food production on another variable like population growth.
- For example, population growth is positively related to food production, But food production is negatively related to pollution, and pollution, in turn, is positively related to industrial output.
- The model also uses past data on such factors as growth rates of population, industrial output, and agricultural production, and the estimates of rates of technological progress. These factors would lead to the use of new resources, raise agricultural productivity, and control pollution.
Assumptions of the Model
- Population increase (the difference between the birth rate and the death rate) is influenced by crowding, food intake, pollution, and the material standard of living. A rise in any of these four factors tends to drive the birth rate downwards. The death rate decreases with increasing food intake and the material standard of living and increases with increasing pollution and crowding.
- The material standard of living depends on the level of capital, relative to the size of the population and the productivity of capital.
- Non-renewable resources are continually used up by the production process. The lower the level of non-renewable resources, the more capital must be allocated to obtaining resources, and thus the productivity of capital for producing finished goods is less.
- Agricultural production depends on land and on capital investment in agriculture. Land can be developed or eroded, depending on investment decisions. Yield per unit of land can be increased by capital, but with diminishing returns.
- Pollution is generated by the production process and gradually absorbed into a harmless form by the environment. High accumulations of pollution, lower the absorbing capacity of the environment.
- population and population growth
- prospect for agriculture productivity improvement for ensuring food security
- status of mineral resource particularly petroleum resource
- possibility of industrial growth
- pollution and ability of the planet to absorb
Explanation of the Model:
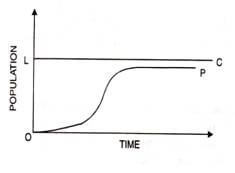
The model shows four possible modes that a growing population can exhibit over time.
- The mode actually observed in any specific case will depend on the characteristics of the carrying capacity. They are the level of population that could be sustained indefinitely by the prevailing physical and biological systems and on the nature of the growth process itself.
- For example, a population growing in a limited environment can approach the ultimate carrying capacity of that environment in several possible ways. It can adjust smoothly to an equilibrium below the environmental limit by means of a gradual decrease in growth rate, as shown in Fig. (A) where LC represents the carrying capacity of the world, while the OP curve represents the population growth curve.

- The second possibility is that it can overshoot the limit and then lie back either smooth or in an oscillatory way, as shown in Figures (B) and (C) respectively.


- The last possibility is that it can overshoot the limit and in the process decrease the ultimate carrying capacity by consuming some necessary nonrenewable resources. This is shown in Figure (D)

Graphic Explanation of the Model:
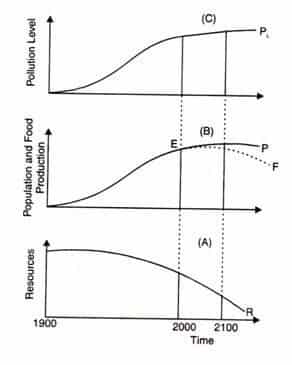
- The Limits to Growth Model is explained in Figure (A), (В), and (C). Time in years is taken on the horizontal axis beginning from the year 1900 to 2100. In Panel (A), resources are measured along the vertical axis and are represented by the downward sloping R curve. Since such resources as oil, natural gas, copper, lead, etc. are fixed, they are being continuously depleted over time from the year 1900 and beyond 2100.

- In Panel (В), the growth of population and food supply are measured on the vertical axis and are represented by the P and F curves respectively. They are shown to increase up to point E at the same rate from 1900 to 2000 year. But beyond the year 2000, the population curve P continues to rise, while the food production curve F rises at a diminishing rate and then starts declining by 2100. In Panel (C), the curve PL shows the pollution level which continues to rise beyond the year 2010 and if not checked in time, will lead to catastrophic results in the world.
Criticisms:
The Limits to Growth (LTG) was an alarming report predicting the collapse of the world economy in the 21st century. It does not account for the infinite possibilities in human innovation. The prediction was based on data and computer simulation techniques which could not have been so refined, exact, and sophisticated like that of today.
Static Reserve Index:
- The model has been criticized for assuming that non-renewable resources are scarce and are likely to be exhausted by the year 2100.
Technological Development
- This model neglects technological developments in resource extraction, use, and substitution. In fact, the size of reserves of non-renewable resources has been increasing due to rapid technological development which makes the extraction of sub-economic stocks of resources less expensive.
Food Production
- The model assumes the availability of limited land and consequent decline in food production. According to H. Kahn, “Whenever certain limits are reached, new technologies are introduced with the passage of time. These technologies effectively either remove the limit or as time passes a subsequent technology can remove the limit.”
- Kahn sees production rising with the invention of new technologies as in the case of the Green Revolution in developing countries which has increased food production and solved their food problem.
Population Growth
- The model predicted that the world population growing at an exponential rate would be 7 billion in 2000. If the mortality rate continues to decline without lowering the fertility rate, it will be 14.4 billion in 2030. But the world population has not grown exponentially.
- It was 6 billion in 2000, as against 7 billion predicted in the model. Highly populated countries like China and India have slowed down their population growth rate by adopting birth control measures. Moreover, empirical studies have shown that economic growth accompanied by rising incomes lowers the fertility rate.
Pollution
- The model assumes that the level of pollution is increasing exponentially in the world due to growth in agricultural and industrial activities. Consequently, the degradation of the environment will adversely affect the quality and existence of human life, and flora and fauna.
- No doubt, pollution of the environment is a serious problem, yet both developed and developing countries are trying to bring down pollution levels by using cleaner technologies. So there is no need for pessimism that pollution will bring doomsday nearer.
- However, pollution can be reduced by a judicious choice of economic and environmental policies and environmental investments. This is only possible through economic growth rather than by zero economic growth, as the model emphasizes.
Price System
- The LTG model neglects the price system and the dynamics of the market system. The model predicts that unlimited economic growth will lead to the depletion of non-renewable resources. But resource optimist economists do not agree with this view.
Zero Economic Growth
- The LTG report suggests a zero rate of economic growth in order to stop the rise in the pollution level. Critics point out that if a positive rate of growth will lead to doom, a zero growth rate will do the same but on a smaller timetable. Instead, they argue that economic growth, especially in developing countries, will provide more resources that can be used to reduce pollution by supplying potable water, sanitation facilities, providing better housing facilities, and reducing congestion in urban areas.
- Moreover, economic growth is the only hope for developing countries to bring people out of the vicious circle of poverty and raise their standard of living. Thus the very idea of a zero rate of economic growth is fanciful.
Its implications
- The Limits to Growth report highlights the dangers posed by the relentless pursuit of material wealth by the developed countries.
- It warns readers about the consequences of unconstrained growth by the industrialized countries.
- Depletion of non-renewable resources, deterioration of the environment, and population explosion. The report calls forth policymakers, NGOs, and the people, in general, to protect the environment, save non-renewal resources, and control the population.
- Another important policy prescription of the LTG model is that the governments should voluntarily adopt a zero-growth policy. Such a policy would require world redistribution of income and wealth.
- For zero economic growth, the redistribution of income and wealth both within and between countries would be on a very large scale. It can only be possible by force which would lead to upheavals between the rich and the poor.
- Moreover, the model fails to explain how redistribution of income and wealth can be affected with zero growth rate.


0 Comments