

A SHORT INSCRIPTION ABOUT DIGITAL ELEVATION MODEL (D.E.M)
Concept of Digital Elevation Model (DEM)
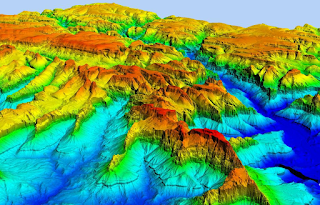
DEM is the acronym of Digital Elevation Model which is the 3D representation of the earth surface. A digital elevation model (DEM) is a 3D computer graphics representation of elevation data to represent terrain, commonly of a planet (e.g. Earth), moon, or asteroid. It is raster GIS layer referenced to a vertical datum representing the Z values at regular intervals over a specified area, usually at a fixed grid interval over the "Bare Earth". The intervals between each of the grid points will always be referenced to some geographical co-ordinate system (latitude and longitude). For more detailed information in DEM data file, it is necessary that grid points are closer together. The details of the peaks and valleys in the terrain will be better modelled with small grid spacing than when the grid intervals are very large. Thus DEM is used to refer specifically to a raster or regular grid of spot heights.A Digital Elevation Model (DEM) is a specialized database that represents the relief of a surface between points of known elevation. By interpolating known elevation data from sources such as ground surveys and photogrammetric data capture, a rectangular digital elevation model grid can be created.A DEM is generated voiding all the natural and man made features thus only representing the bare earth with the elevation useful for land use planning, hydrology and soil conservation. The term DEM was introduced in the 1976 with the purpose of distinguishing the simplest form of terrain relief modelling.
Creation of DEMs:
Several methods are available to create DEM
Basic Manipulations
There are several basic manipulations that can be done with ArcMap. This involves tools under Spatial Analyst > Surface (the Spatial Analyst extension needs to be turned on in order for this to work properly).
2. Aspect: Another derivative is the aspect map (fig. 2.2). This map displays the aspect of each raster cell grouped into compass directions (north, northwest, etc.).
3. Hillshade: This tool creates a map with a shade-effect (fig. 2.3) based on the input parameters that are entered in the tool. The resulting map is easier to interpret than the original DEM, because some topographic features are better visible (on small scale especially).
4. Curvature: The curvature map (fig. 2.4) is calculated by using the curvature tool. This basically calculates the relative change in slope, could be seen as a second order DEM derivative.

5. Contour: Topographic contour lines can be plotted with the contour tool (fig. 2.6). Based on the user defined parameters the new map will display (elevation based) contour lines.
6. Viewshed & Observer Points: These tools are used to calculate a (set of) positions relative to a user defined (point) feature (fig. 2.7). This is useful to determine the visibility of a location.
7. Another useful way to display a DEM is to use the “Select attribute” feature (fig. 2.8). By inserting a query and selecting a threshold, it is possible to select certain elevations on the map and display the location of these points.
8. If you want to go a step further, maybe in order to classify the DEM based on elevation, you could use the reclassify tool (fig. 2.9). With the reclassified map it is possible to do a raster calculation in order to calculate a function for each raster cell (with each variable having its own map with values).
OK,lets Elaborately filtered out some Common FAQ's about these article.
 What is the vertical accuracy of the 3D Elevation Program (3DEP) DEMs?
REQUISITES OF D.E.M
Deriving from the above discussion about the generation of DEM we can infer that the Generation of DEM requires the following parameters ;
1.The Iso-heights of surveyed contours.
2.Spot heights or heights obtained by GPS/DGPS
3.Trig heights obtained by Triangulation
4.Randomly sampled height from MSL for a set of surveyed points of the earth surface.
5.Satellite image or an area taken by UAV.
6. Layer-wise vector data
7. Grid heights
8. Almanac data of an area with respect to time.
GIS Software for working with DEMs
QGIS,ARCGIS,Snap Toolbox,GEE,GRASS,MAPINFO,Maptitude Mapping Software gives you all of the neccessary tools, maps, and data you need to analyze and understand how geography affects you and your business including surface analysis tools and 3D tools based on digital elevation models.
IF YOU INTERESTED TO KNOW ABOUT AQUISITION PROCEDURE OF FREE GEOSPATIAL DATA COLLECTION THOUGH DIGITAL ELEVATION MODEL , THEN put a Comment,Your Wishes will be published in the upcomings with a detailed overview broad hand experinced on QGIS/ARCGIS/SAGAGIS software.
DEM Derrivatives
DEM derivates are the set of information that are derived from DEM after processing one significant DEM derivatives are enlisted below
Extracting terrain parameters.
Mod water flow or mass movement (for example, landslides).
Creation of relief maps.
Rendering of 3D visualizations.
Creation of physical models (including raised-relief maps).
Rectification of aerial photography or satellite imagery.
Reduction (terrain correction) of gravity measurements (gravimetry, physical Geodesy).
Terrain analyses in geomorphology and physical geography.
USES OF DEM
Common uses of DEMs Are below include:

Extracting terrain parameters
Modeling water flow or mass movement (for example avalanches and landslides)
Cartographic relief depiction
Rendering of 3D visualizations.
3D flight planning
Creation of physical models (including raised-relief maps)
Rectification of aerial photography or satellite imagery.
Reduction (terrain correction) of gravity measurements (gravimetry, physical geodesy).
Terrain analyses in geomorphology and physical geography
Geographic Information Systems (GIS)
Engineering and infrastructure design
Global positioning systems (GPS)
Line-of-sight analysis
Base mapping
Flight simulation
Precision farming and forestry
Surface analysis
Intelligent transportation systems (ITS)
Auto safety / Advanced Driver Assistance Systems (ADAS).
APPLICATION & SIGNIFICANCE OF DEM
The ever increasing use of spatial modelling techniques and algorithms in various sectors of development have vastly populated the use of DEM. The application of DEM had unfurled various sections of development in both military and civilian workspace. The following is a list, which highlights the undisputed significances of DEM;
Comprehensive Study : DEM provides a comprehensive visualisation of the terrain surface thus it becomes easy for the end-user to derive various hybrid datasets.
Planning : DEM helps the user to plan the future as per the present scenario for
optimum sustainable development against terrestrial catastrophic vulnerability, also helps
in the detection and conservation of the eroded features in order to maintain the stability. 
Production of Time-series data : Delineating the change it is possible to generate future predictability model on temporal interval based on the DEM of present time thus helping in shaping the future.
Change detection: Through the generation of DEM it is possible to detect the change on the represented spatial dimension also the determination of the processes paving the way.


 Inscription)
0 Comments